MERSCOPE PanCancer Pathways Human Panel
Explore tumor biology and interactions within the tumor microenvironment
Vizgen's predesigned MERSCOPE® PanCancer Pathways Panel (Human) for the MERSCOPE® Platform provides researchers with a curated list of 500 biologically relevant genes signaling pathways of cancer. Our application-specific panel significantly decreases startup time for beginning your MERFISH journey with MERSCOPE.

FIGURE 1
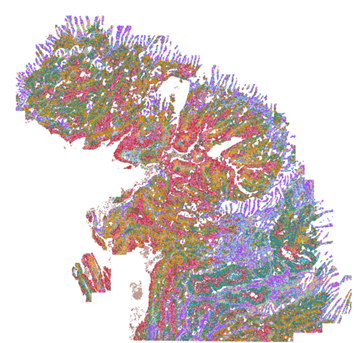
Figure 1. Clustered cells are spatially displayed across a Human Breast Cancer tissue section.
MERSCOPE PanCancer Pathways Panel
Vizgen’s MERSCOPE PanCancer Pathways Panel accurately detects major cell types and their spatial distribution across cancerous tissue samples.
MERSCOPE PanCancer Pathways Panel Advantages:
- Explore canonical signaling pathways of cancer
- Characterize tumor behavior
- Investigate interactions between tumor, immune, and stromal cells across human cancers
- Compatibility across Breast Cancer, Lung Cancer, Liver Cancer, Prostate Cancer, Colon Cancer, Melanoma, Ovarian Cancer, Brain Cancer
- Tissue preservation compatibility – Fresh Frozen, Fixed Frozen, Cell Culture, and FFPE
RESOURCE DOWNLOAD
Vizgen MERSCOPE Predesigned Panel Flyer

Download Now
Curated List of 500 Genes Targeting the Canonical Signaling Pathways of Cancer
Spatial transcriptomics provides powerful insights into complex biology but can require high costs in time and resources to build comprehensive gene panels of interest. We constructed the panel using recognized oncology databases including OncoKB1, MutSig2, The Cancer Genome Atlas3, and Hallmarks of Cancer4 to ensure the inclusion of critical cancer genes.

FIGURE 2
Figure 2: List of gene sets included in the MERSCOPE PanCancer Pathways Panel.
.png?width=387&height=419&name=MicrosoftTeams-image%20(84).png)
FIGURE 3
Figure 3: Researchers will be able to explore tumor biology and interactions of tumor cells with stromal and immune cells with the PanCancer Pathways Panel.
Validating the PanCancer Pathways Panel
The PanCancer Pathways Panel accurately detects major cell types and their spatial distribution across cancerous tissue samples
Strong Correlations between Technical Replicates, Bulk RNA-seq Data and Tissue Preservation Types

FIGURE 4
Figure 4: The PanCancer Pathways Panel reproducibly detects gene expression across cancer types. (A) Correlation of MERFISH data from two melanoma sections of the same tissue block. Each blue point corresponds to a given gene included in the PanCancer Pathways Panel. The X and Y axes correspond to the number of transcript counts identified per gene in the 2 technical replicates. This correlation describes the global similarity of the transcript quantities identified in each experiment. (B) Correlation of MERFISH data from a melanoma section run on the MERSCOPE® Platform with block-matched bulk RNA-seq data. Each dot represents a given gene in the PanCancer Pathways Panel. Here, the Y axis corresponds to the transcript counts per gene in a melanoma MERFISH dataset, while the X axis corresponds to the FPKM for each given gene in the PanCancer Pathways Panel, as quantified by bulk RNA-seq on the same tissue block. This correlation describes the global similarity between an individual MERSCOPE experiment and orthogonal methods of evaluating transcription. (C) Table detailing the correlations between technical replicates of the various tumor types. FF refers to fresh-frozen sample replicates and FFPE refers to formalin-fixed, paraffin-embedded technical replicates. The final column shows the correlation of expression across different preservation methods. Lung and colon cancer samples are patient-matched. Tissues types not investigated are marked by grey boxes.
Verification of biological accuracy in panel detection

FIGURE 5
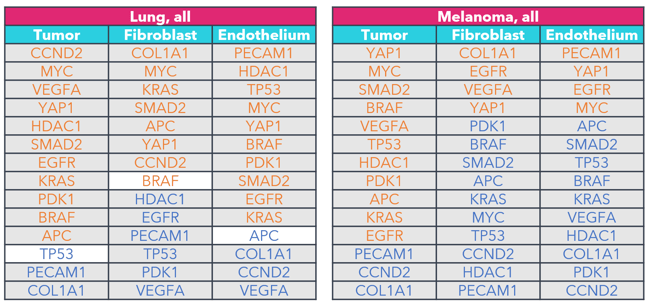
Figure 5: Key marker genes overexpressed in tumor cells, fibroblasts, and endothelium when compared to immune cells. The differential expression of the same 14 canonical marker genes across all tumor samples tested by this panel were analyzed. Genes are listed by magnitude of differential expression. Genes in orange are overexpressed compared to immune cells, while genes in blue are under expressed when compared to immune cells. Gray shading is used to identify genes that exhibit statistically significant differential expression (p < 0.05; Wilcoxon signed-rank).
References
- https://www.oncokb.org/
- https://software.broadinstitute.org/cancer/cga/mutsig
- ttps://www.cancer.gov/tcga
- Douglas Hanahan; Hallmarks of Cancer: New Dimensions. Cancer Discov 1 January 2022; 12 (1): 31–46. https://doi.org/10.1158/2159-8290.CD-21-1059.
