FFPE Human Immuno-Oncology Data Release Overview:
| Species Type | Human |
| Tissue Type | 8 tumor types |
| Gene Panel Size | 500 |
| Number of Samples | 16 total; 2 colon cancer, 2 liver cancer, 2 melanoma, 4 ovarian cancer, 2 prostate cancer, 2 lung cancer, 1 breast cancer, 1 uterine cancer |
| Total Transcripts Detected | 4,129,432,299 |
| Total Cells | 8,696,580 |

MERSCOPE FFPE workflow is highly sensitive, accurate and reproducible
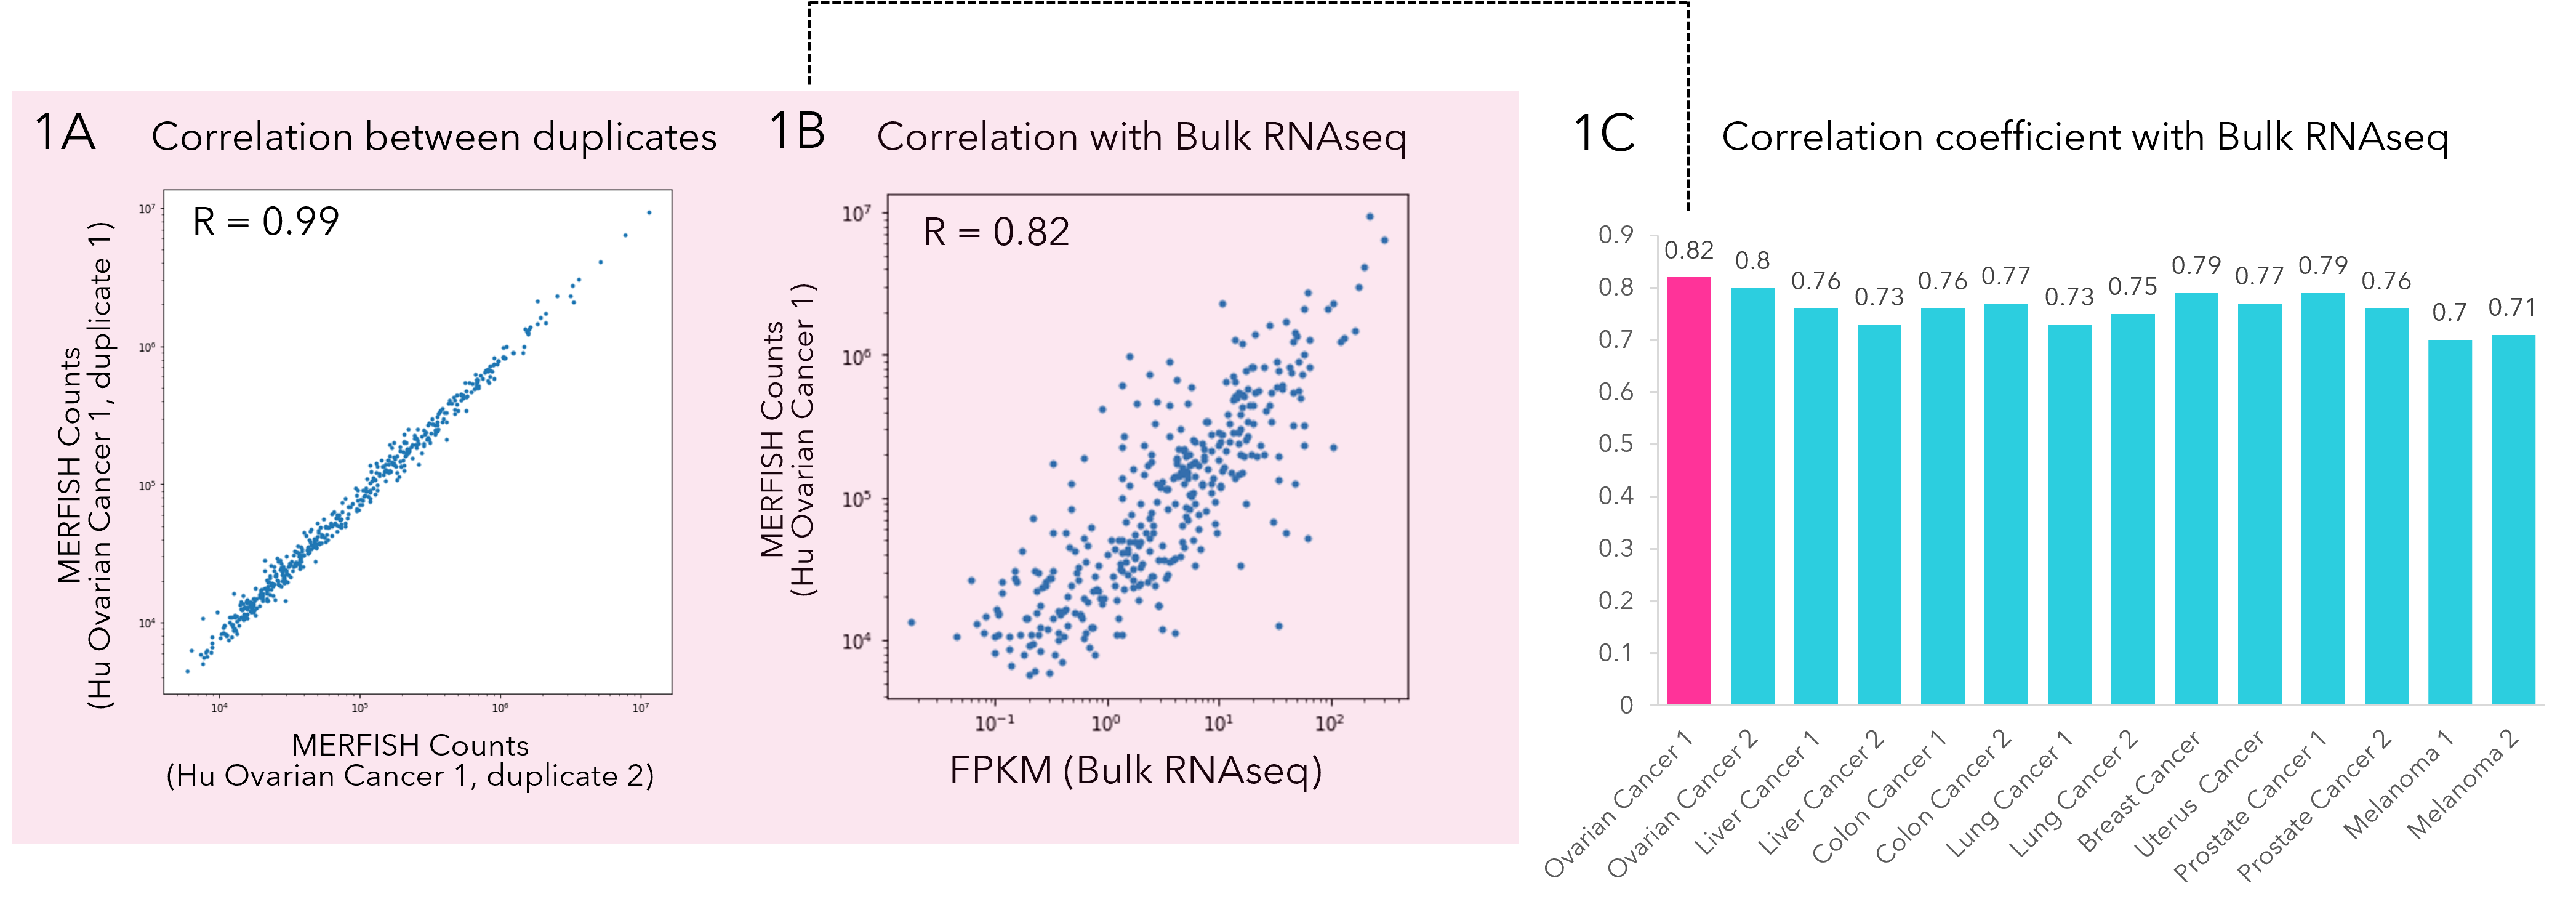
The MERSCOPE FFPE Sample Prep Solution's unmatched accuracy with bulk RNA-sequencing data across the entire expression profile provides accurate detection of high, middle, and low abundance genes. Figure 1A Correlation of MERSCOPE data between two human ovarian cancer slices from the same patient. Correlation coefficient is 0.99, indicating the measurement is highly reproducible. Figure 1B Correlation analysis between MERFISH counts and FPKM values from bulk RNA sequencing on Human Ovarian Cancer 1. The correlation coefficient is 0.82, indicating the measurement is highly accurate. Figure 1C Correlation analysis between MERSCOPE data and bulk RNA sequence was performed across 14 cancer samples, and correlation coefficients show high accuracy across multiple cancer types and replicates.
Figure 1
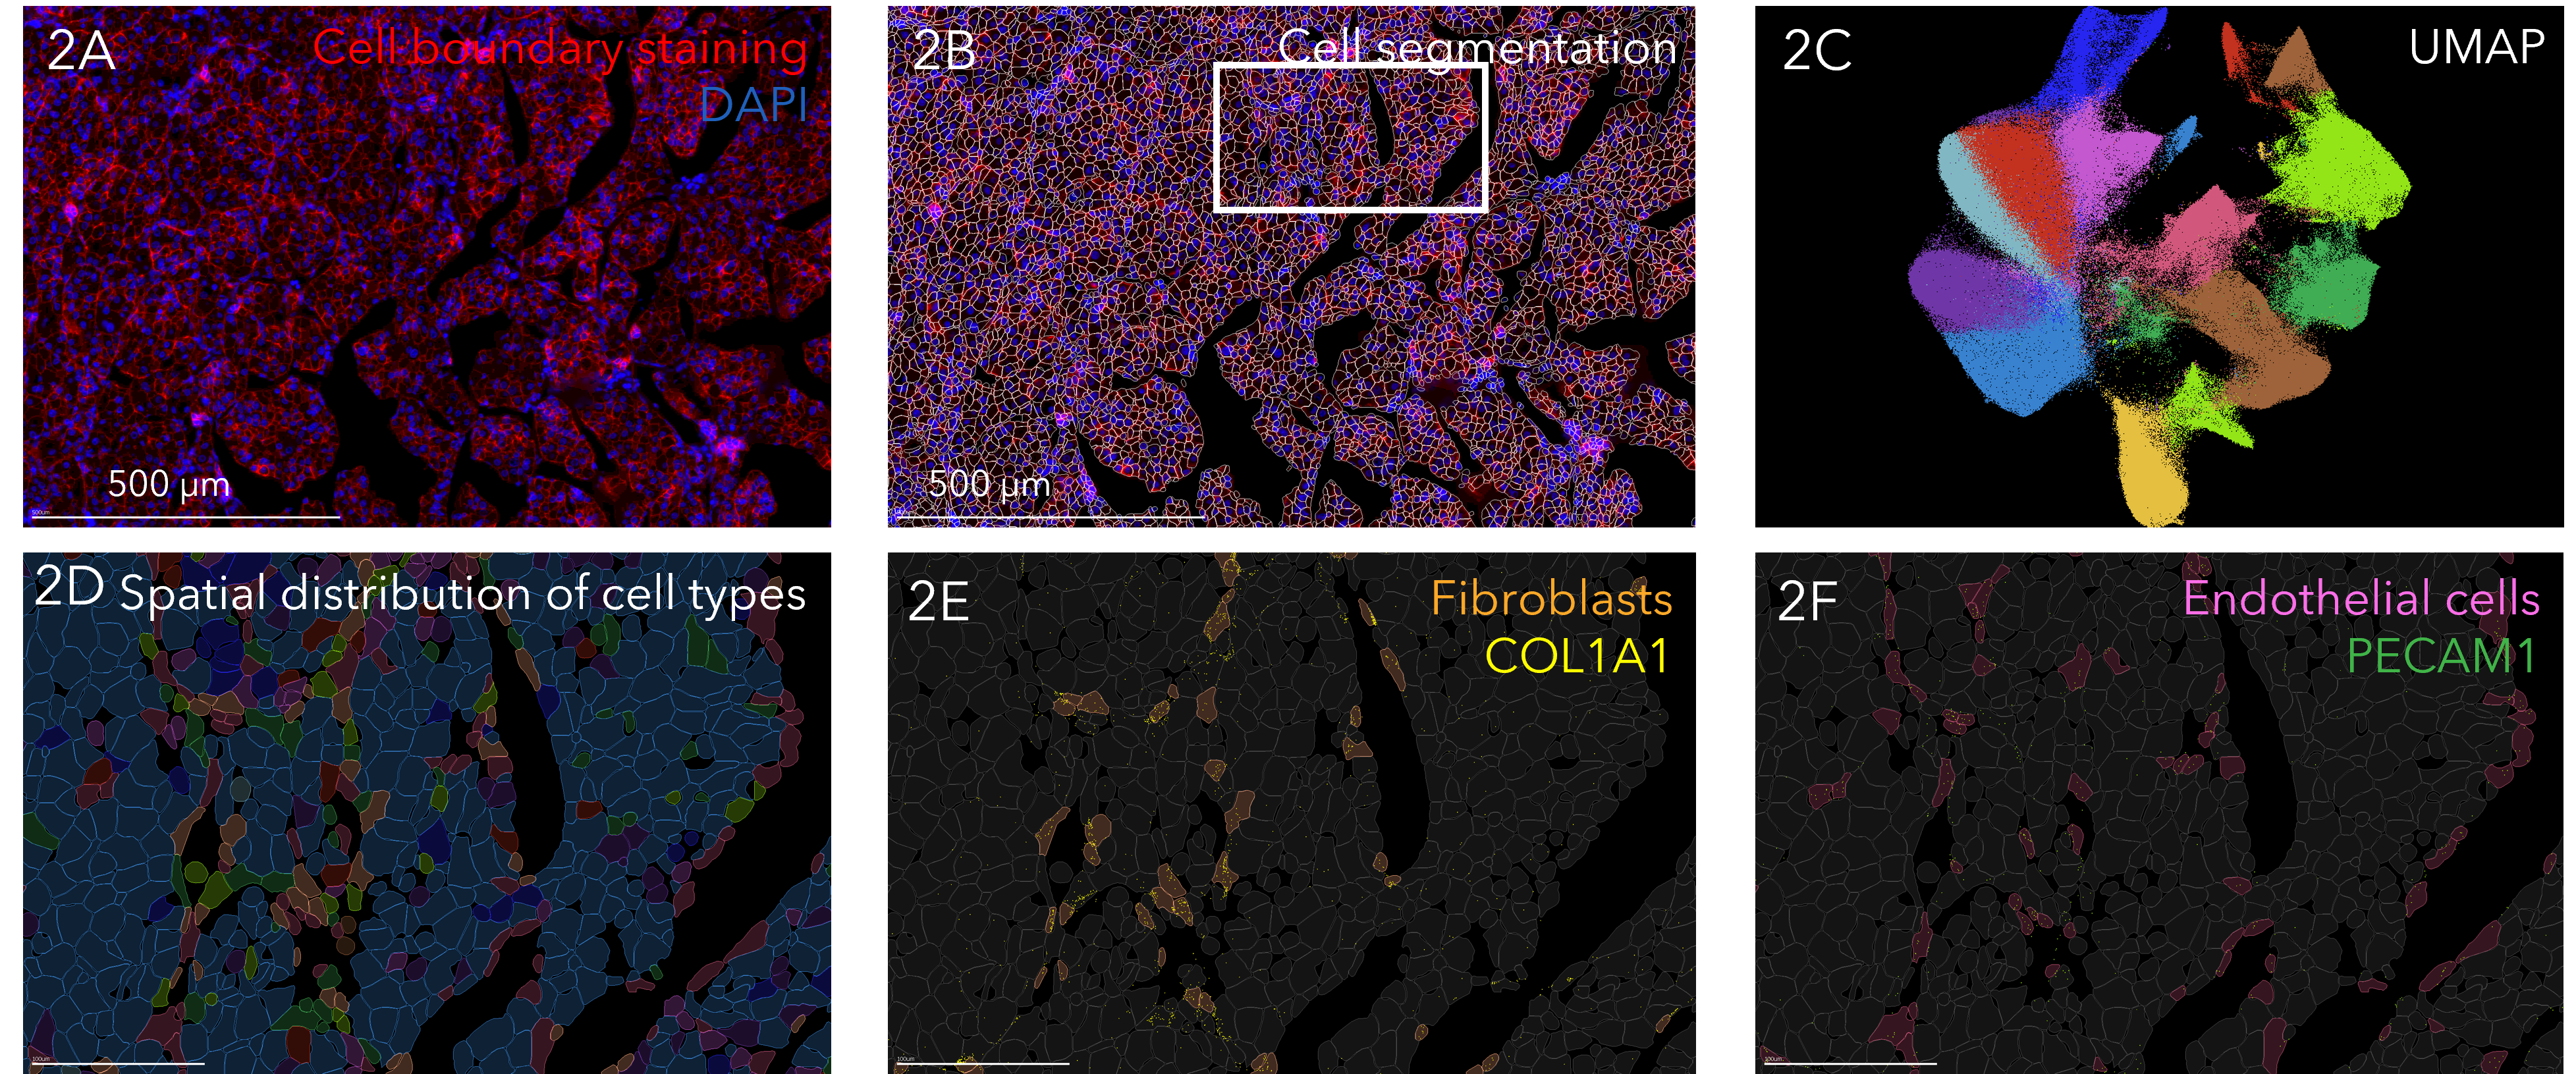
MERSCOPE cell segmentation workflow enables true cell atlasing in dense tissue
Figure 2A FFPE human liver cancer was immunostained with Vizgen’s cell boundary staining kit; plasma membrane staining shown in red and nucleus staining in blue. Figure 2B Deep learning-based cell segmentation algorithm was used to segment cells. The polygon masks for each identified cell are shown. Figure 2C UMAP visualization of 17 different cell types identified in human liver cancer generate from MERFISH transcript data. Figure 2D Spatial distribution of identified cell types across the tissue in boxed region from 2B. Figure 2E spatial distribution of fibroblasts in boxed region from 2B. Fibroblast marker gene COL1A1 shown in yellow. Figure 2F spatial distribution of endothelial cells in boxed region from B. Endothelial marker gene PECAM1 shown in green.
Figure 2
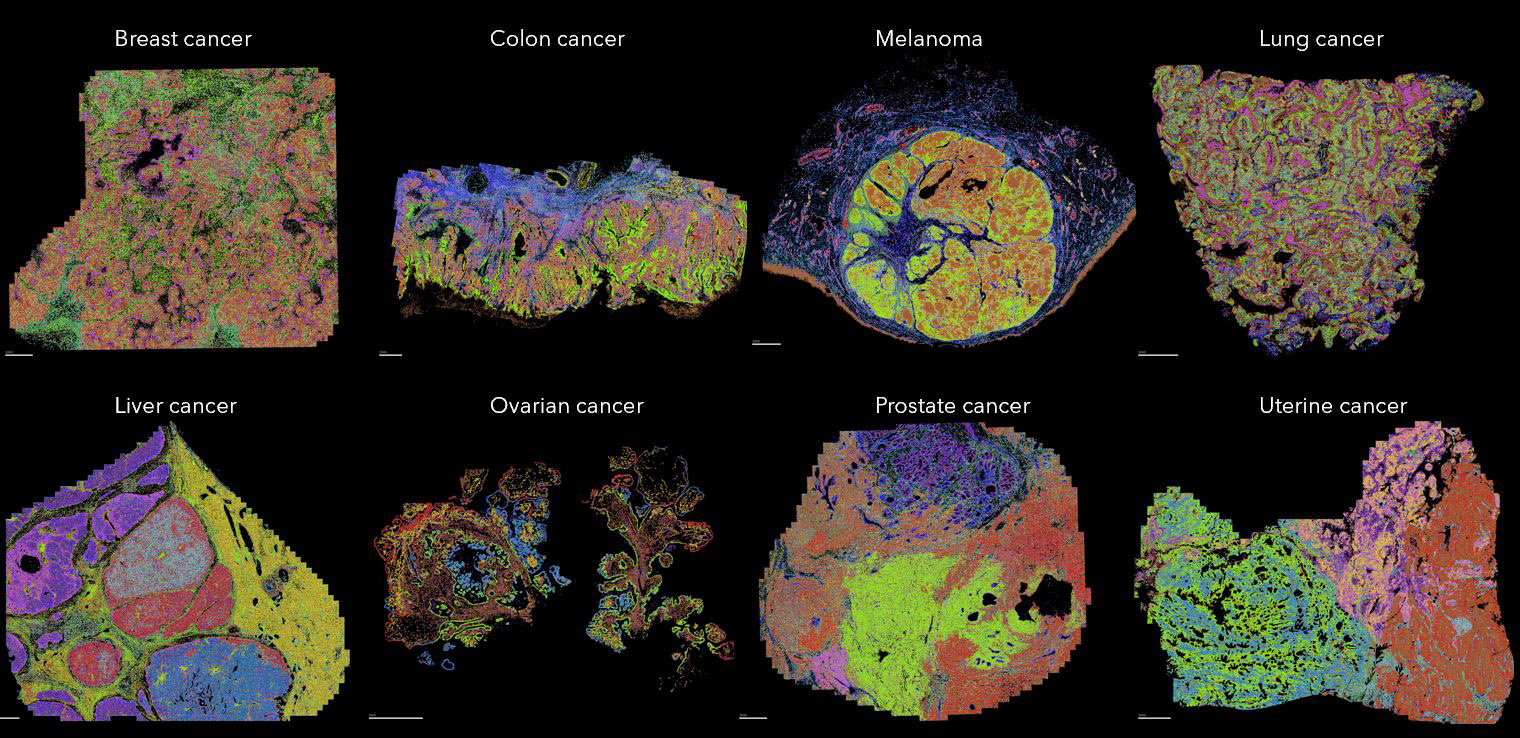
MERSCOPE maps the spatial location of different cell types across multiple FFPE human cancer samples
Different cancer samples, including breast cancer, colon cancer, melanoma, lung cancer, liver cancer, ovarian cancer, prostate cancer and uterine cancer, were analyzed by MERSCOPE using the Human Immuno-Oncology predesigned panel together with cell boundary staining kit to label the cell boundary. Cells are segmented and subjected for single cell analysis. Identified cells in each sample are colored to show the spatial distribution of different cells across the sample. Scale bar: 1mm.
Figure 3
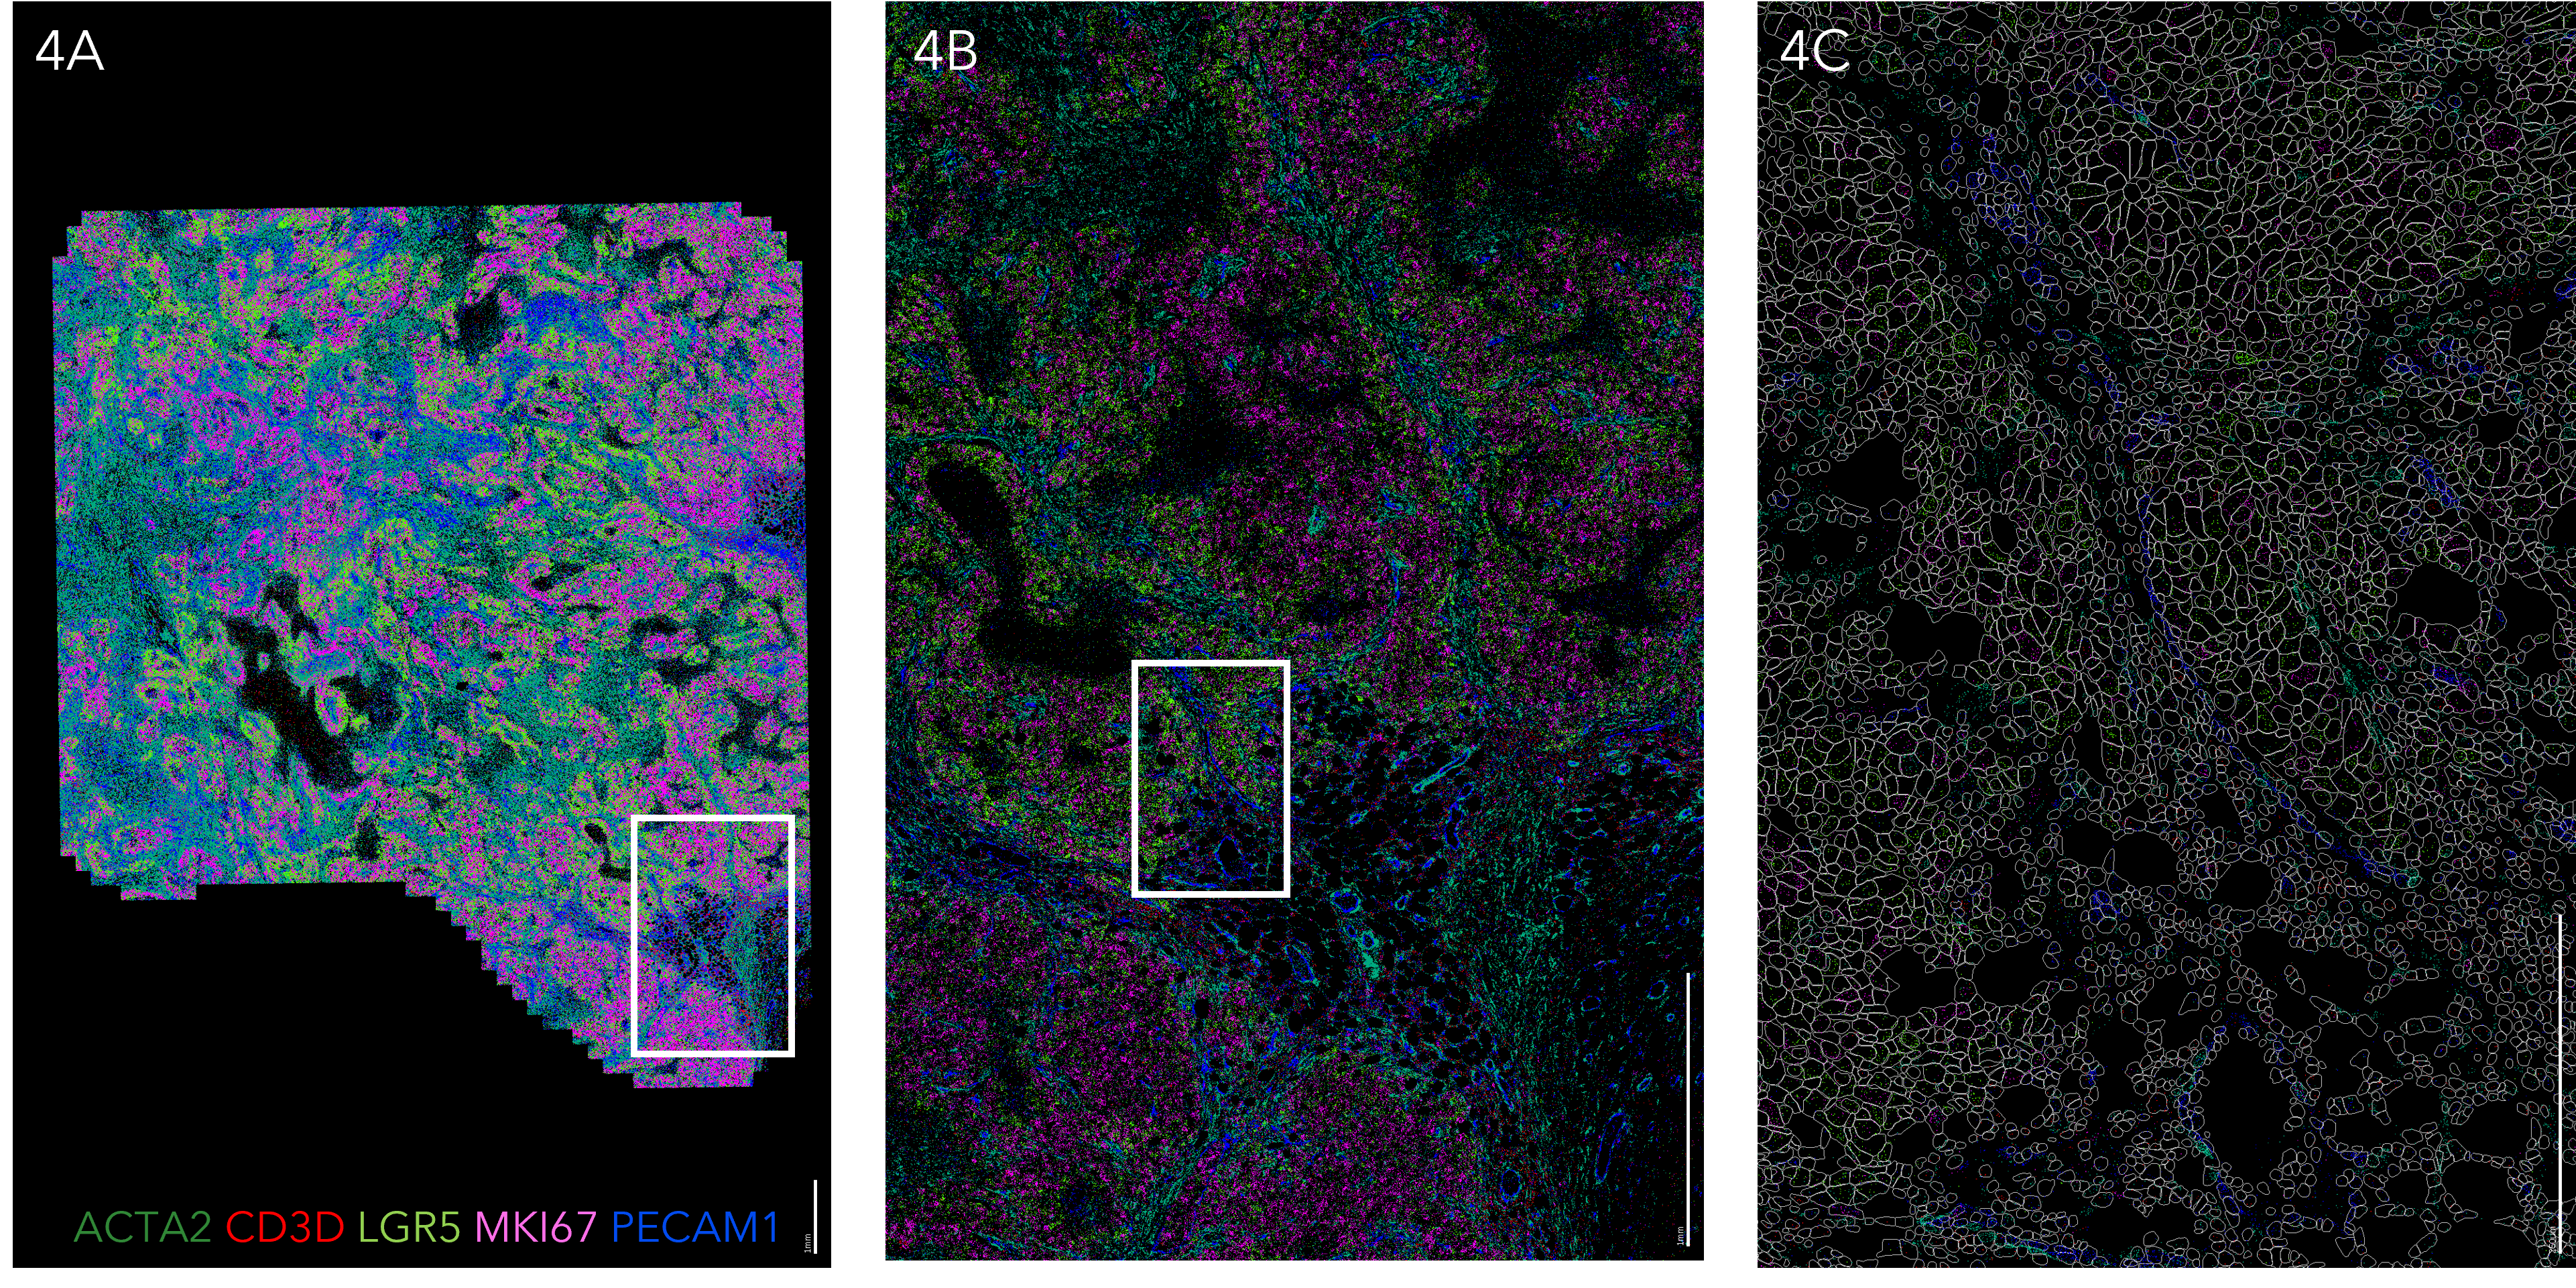
MERSCOPE spatial analysis of select genes in human breast cancer
Figure 4A Spatial distribution of select genes including ACTA2 (green), CD3D (red), LGR5(light green), MKI67 (magenta) and PECAM1 (blue) from 500 genes analyzed across the tissue. Scale bar: 1mm. Figure 4B Zoom-in of the boxed region in A. Scale bar: 1 mm. Figure 4C Zoom-in of the boxed region in B, with cell boundary polygon masks shown in grey. Scale bar: 250 µm
Figure 4
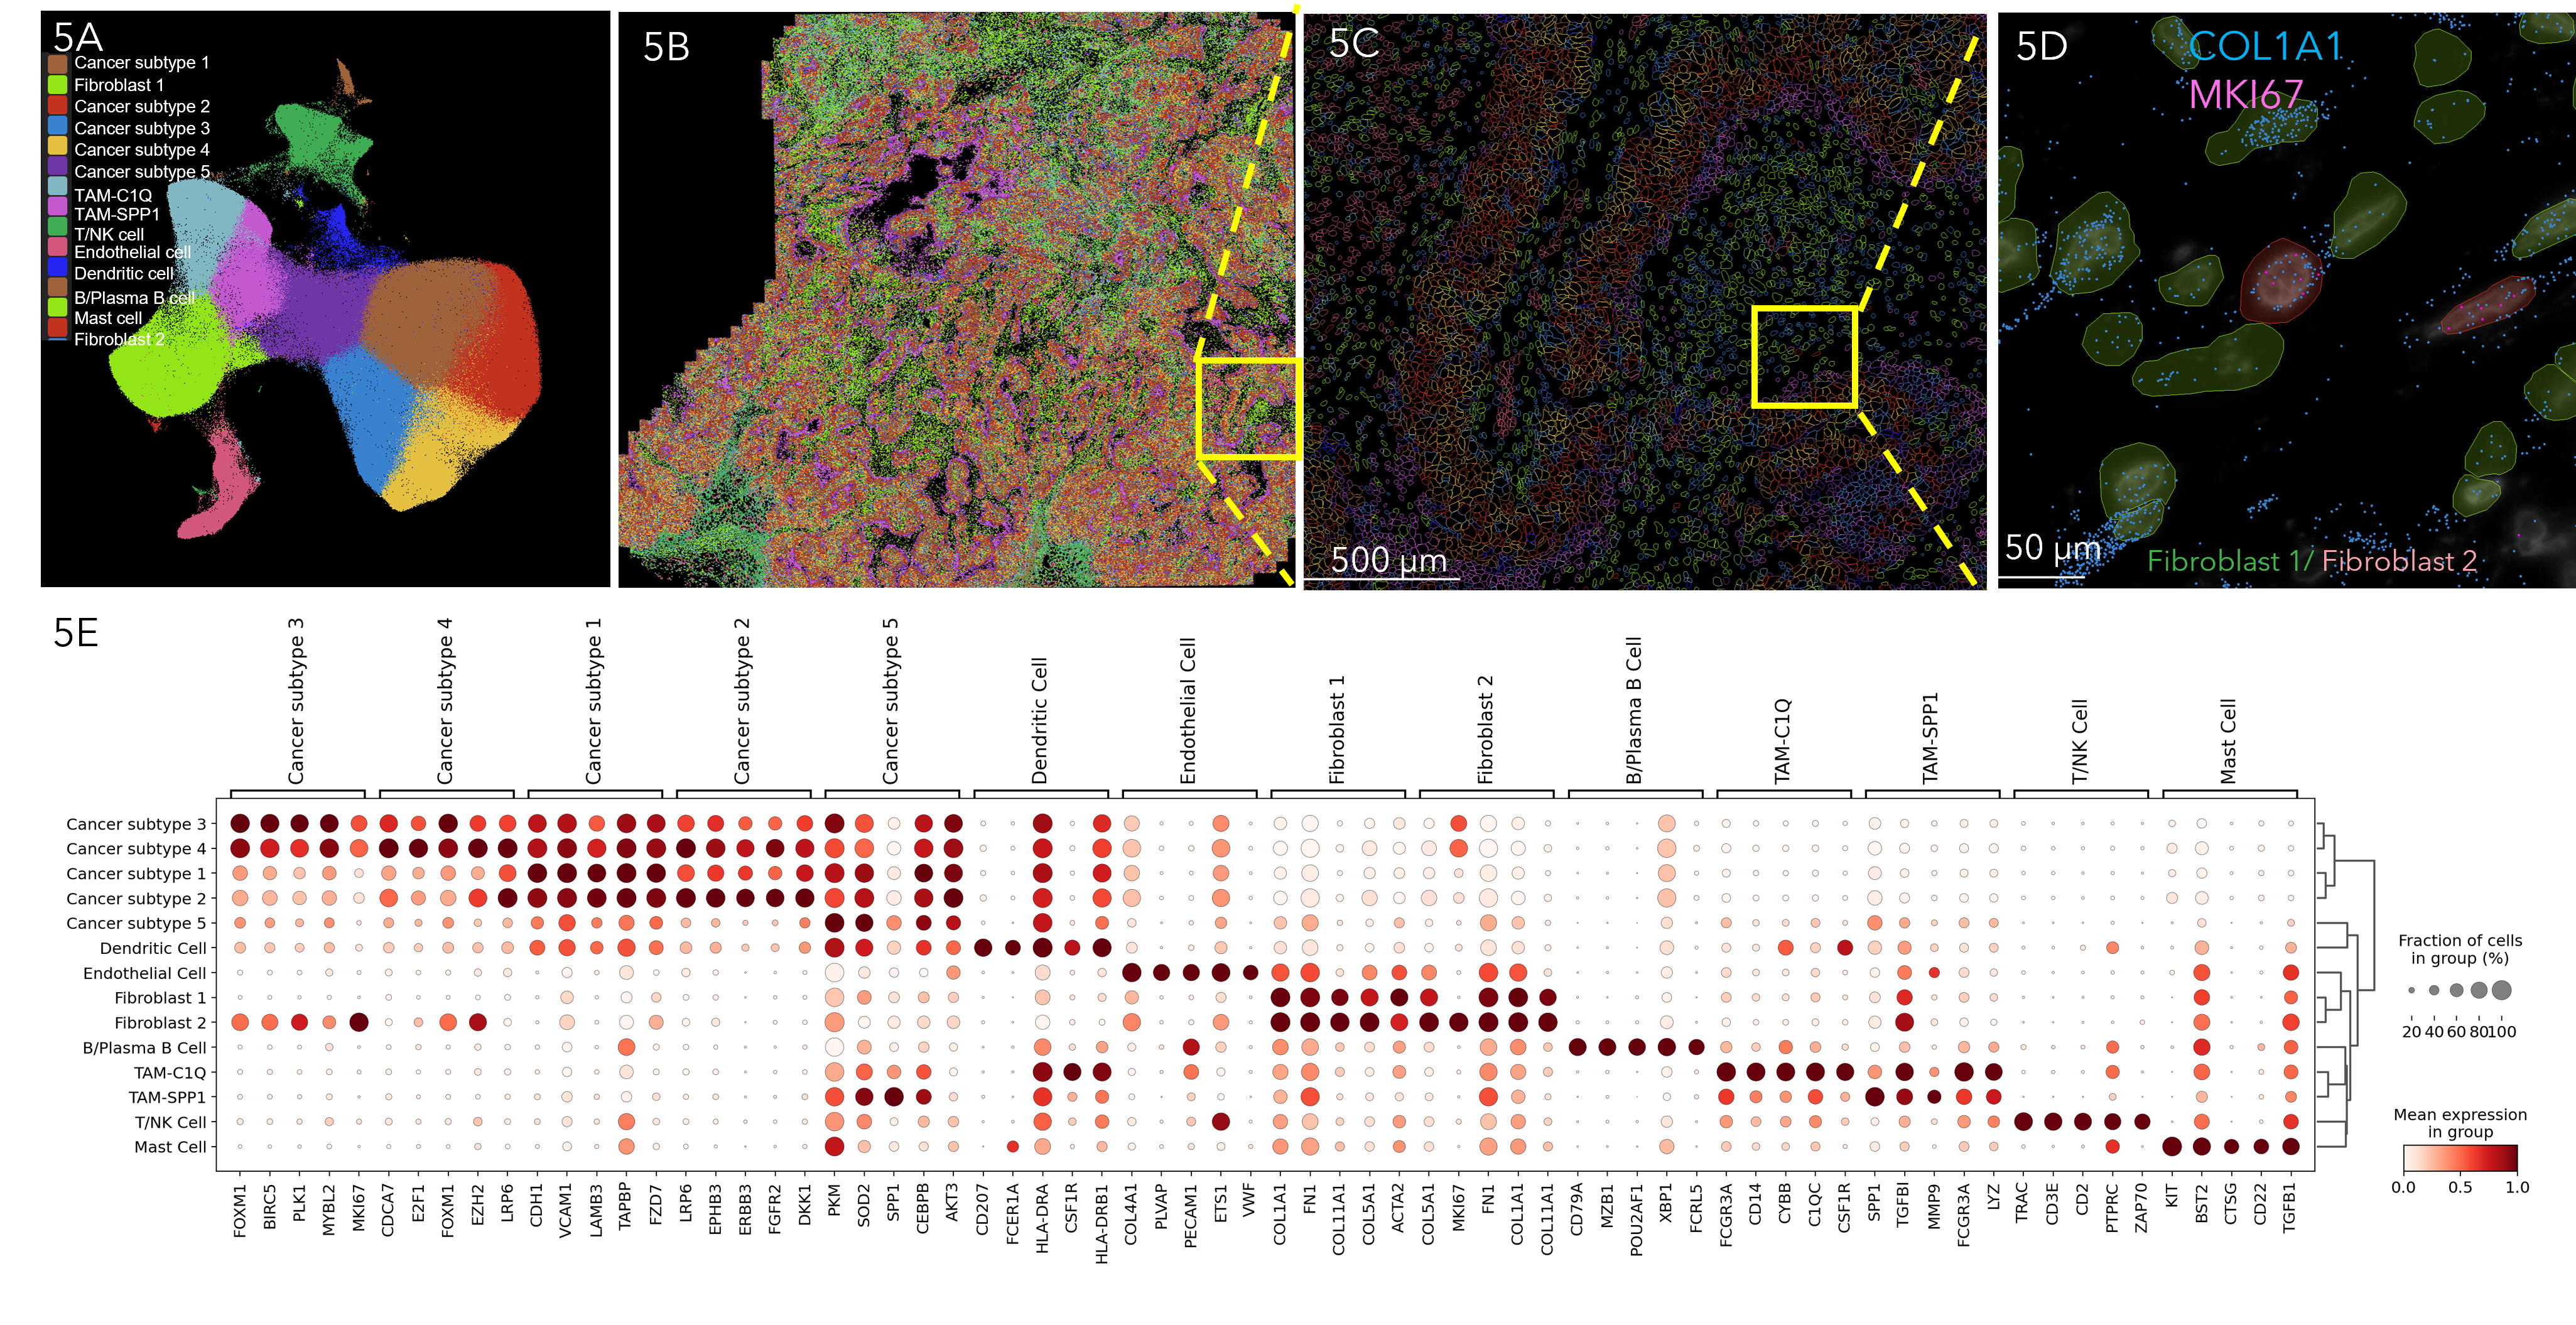
MERSCOPE cell type identification and mapping in human breast cancer
Figure 5A UMAP visualization of different cell types identified in human breast cancer generated from MERFISH transcript data. Figure 5B Spatial distribution of 14 identified cell types across the tissue. Figure 5C Spatial distribution of identified cell types in boxed region in B. Figure 5D Spatial distribution of two types of fibroblasts (fibroblast 1 in green and fibroblast 2 in red) in boxed region in C. Both types of fibroblasts express COL1A1 gene, while fibroblast 2 expresses proliferation marker MKI67. Figure 5E Dot plot showing the marker genes for each cell type.
Figure 5
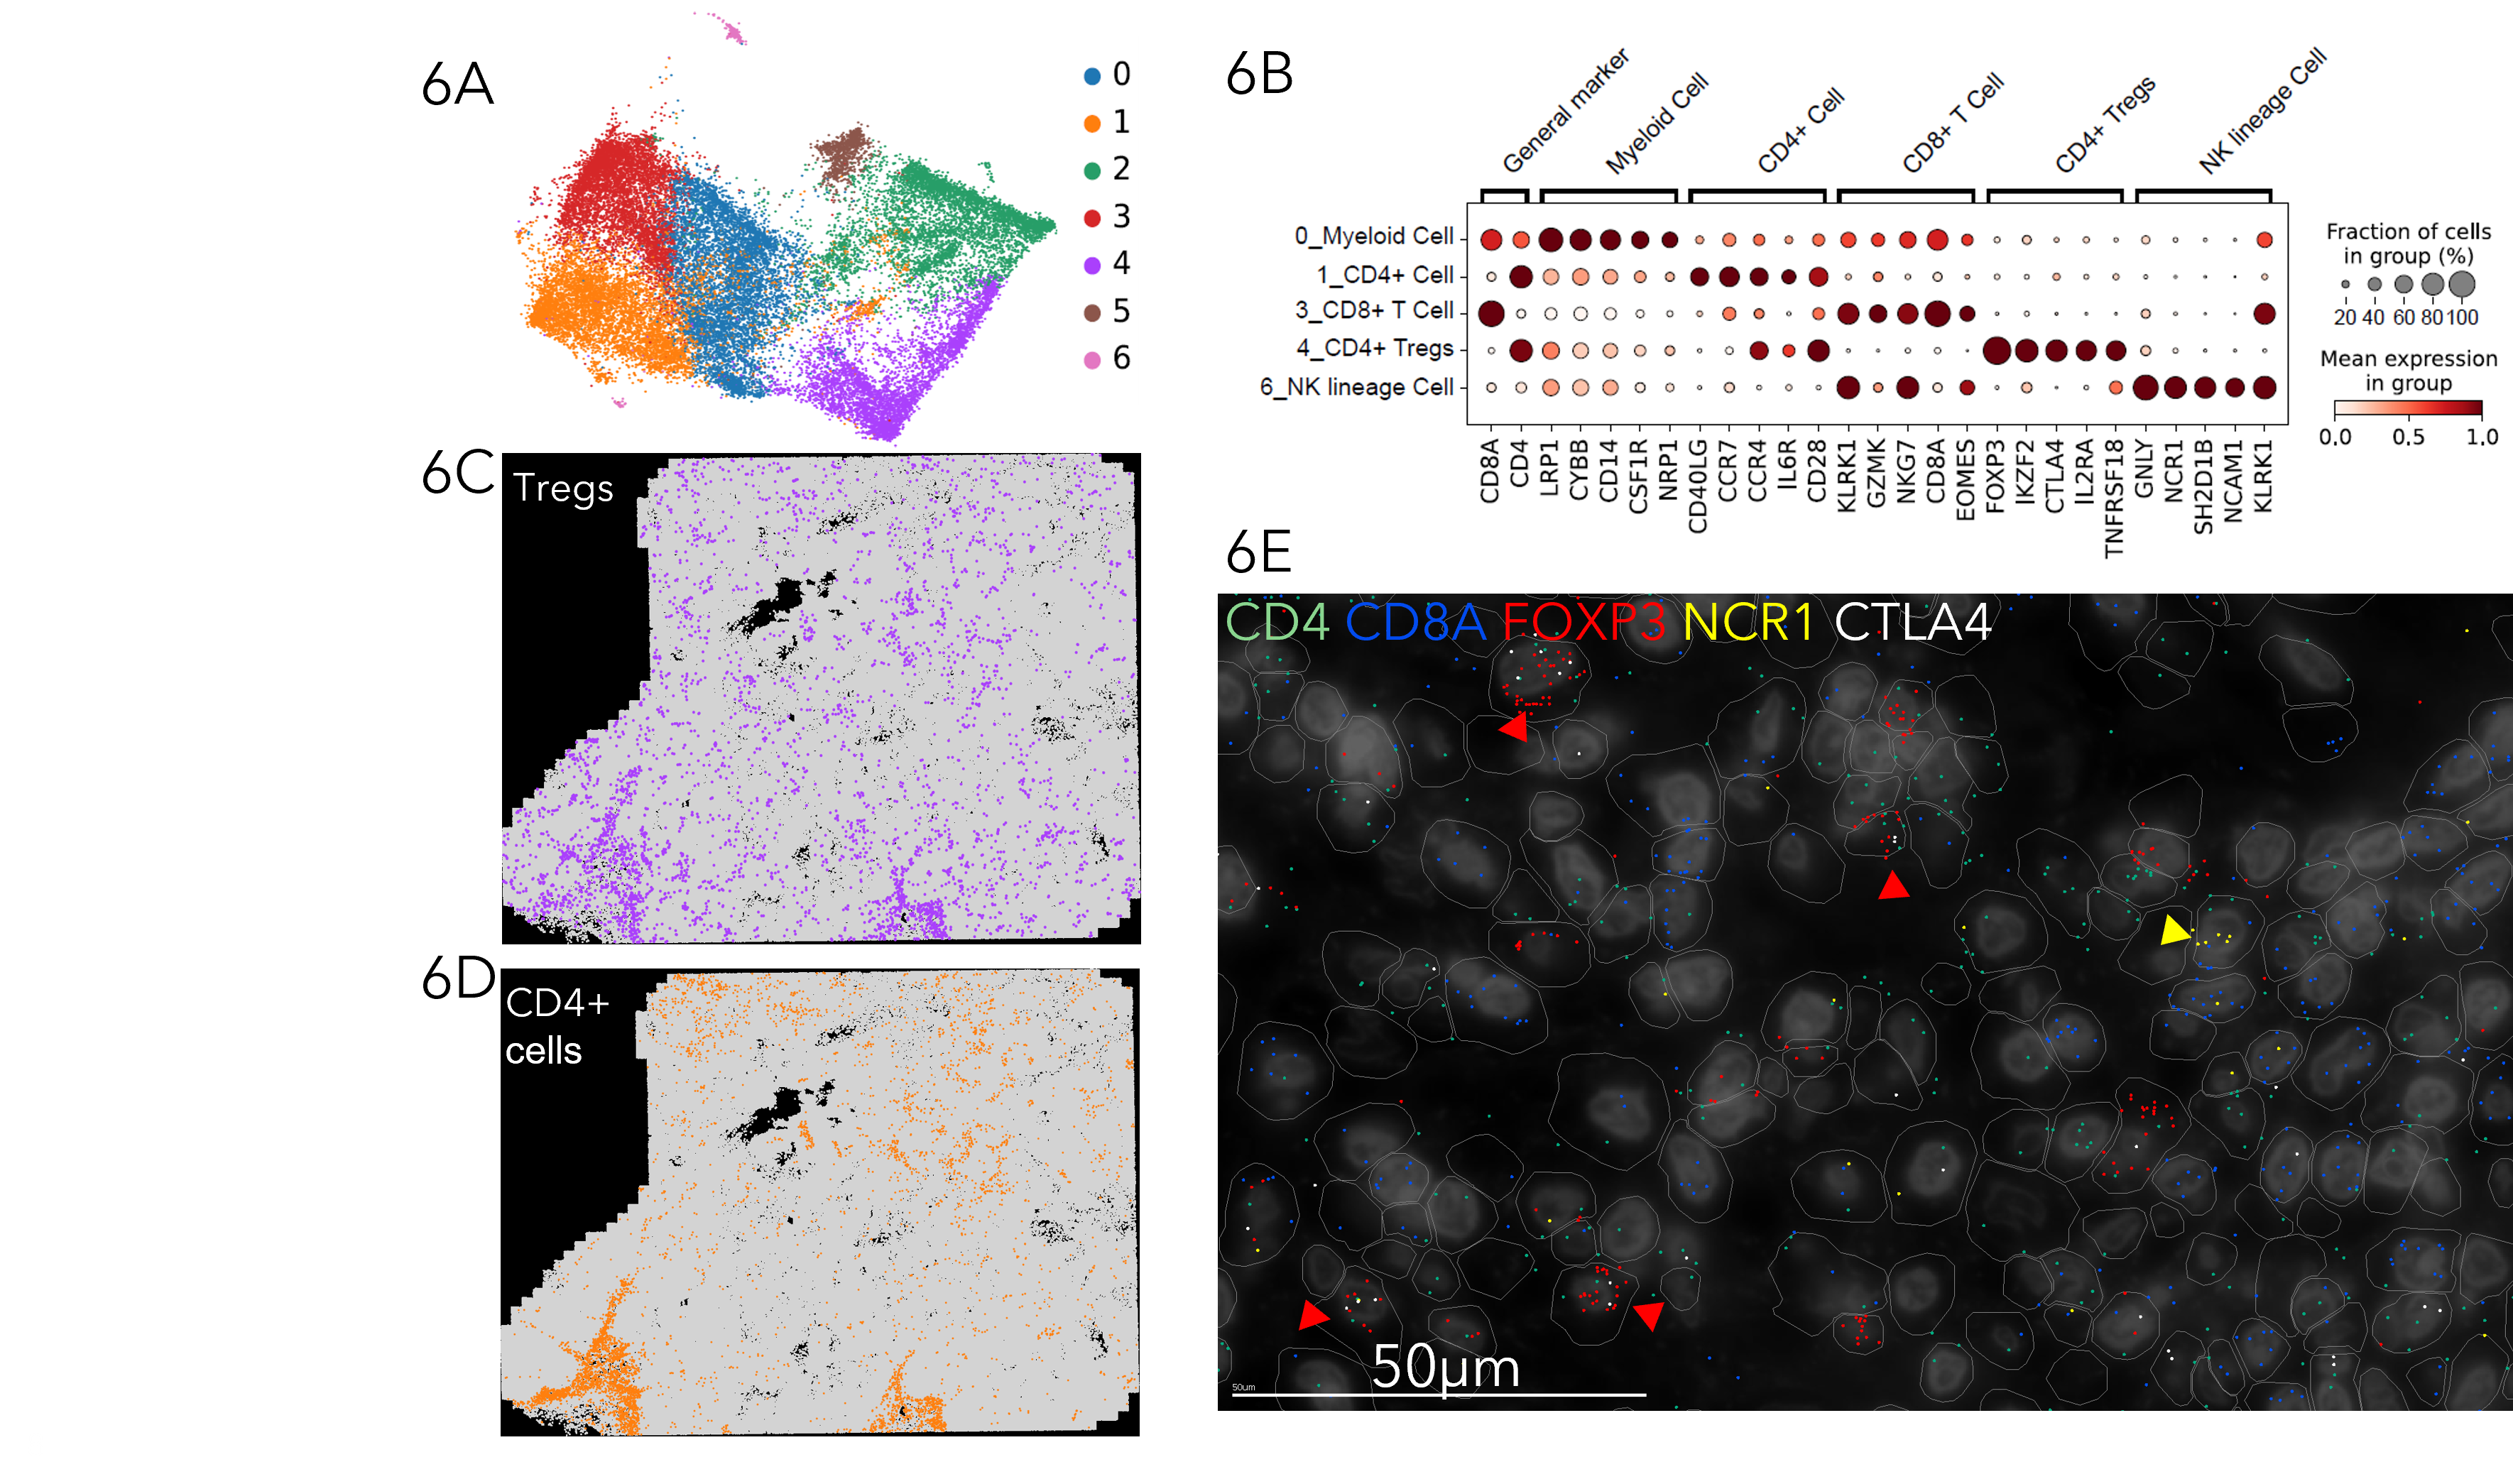
MERSCOPE characterization of immune cell types in the tumor microenvironment
Figure 6A The T/NK cell cluster from a breast cancer sample was selected for sub-clustering analysis. UMAP visualization of sub-clustering analysis showing 7 different immune cell subtypes within human breast cancer. Figure 6B Dot plot showing the marker genes for each immune cell type, including Myeloid cells, CD4+ T cells, CD8+ T cells, CD4+ regulatory T cells (Tregs), and NK lineage cells. Figure 6C Spatial distribution of Tregs. Figure 6D Spatial distribution of CD4+ T cells. Figure 6E Spatial distribution of select genes within a magnified region in human breast cancer, with CD4 (green), CD8A (blue), FOXP3 (red), NCR1 (yellow) and CTLA4 (white) shown. Note that FOXP3 positive Tregs expresses T cell exhaustion marker CTLA4 marked by red arrowhead. NK cell marked by yellow arrowhead